Financial Highlights
Operating Results (Consolidated)
Safety and Per Share Data (Consolidated)
Target of Result (Consolidated)
| Subject | 2020.3 | 2021.3 | 2022.3 | 2023.3 | 2024.3 |
|---|---|---|---|---|---|
| Operating Results (in millions of yen) | |||||
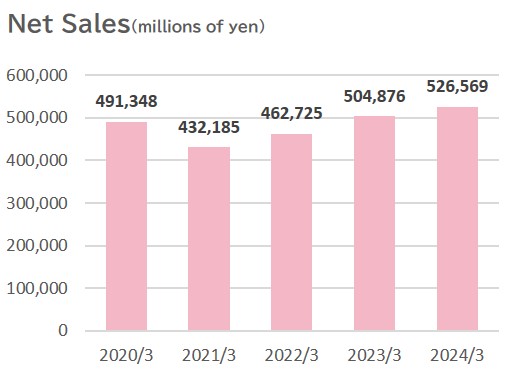
| Net sales | 491,348 | 432,185 | 462,725 | 504,806 | 526,569 |
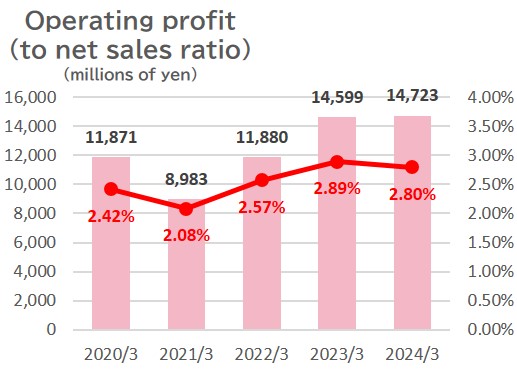
| Operating profit | 11,871 | 8,983 | 11,880 | 14,599 | 14,723 |
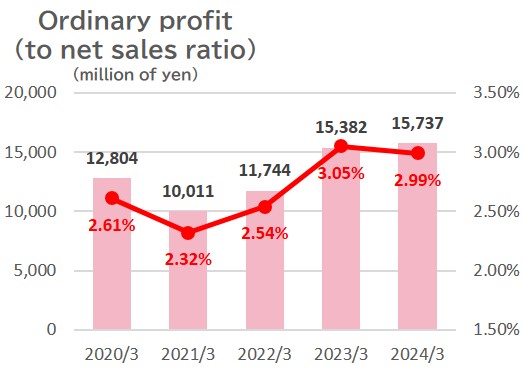
| Ordinary profit | 12,804 | 10,011 | 11,744 | 15,382 | 15,737 |
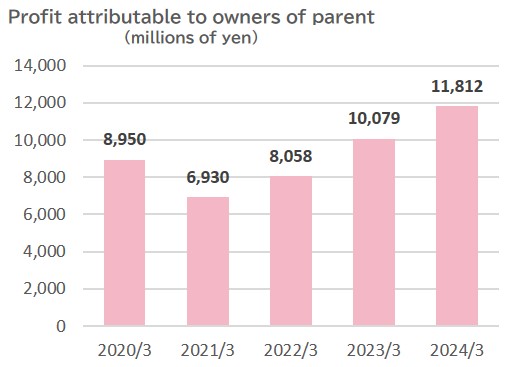
| Profit attributable to owners of parent | 8,950 | 6,930 | 8,058 | 10,079 | 11,812 |
| Financial Position (in millions of yen) | |||||
| Total assets | 237,071 | 237,487 | 259,413 | 271,218 | 290,989 |
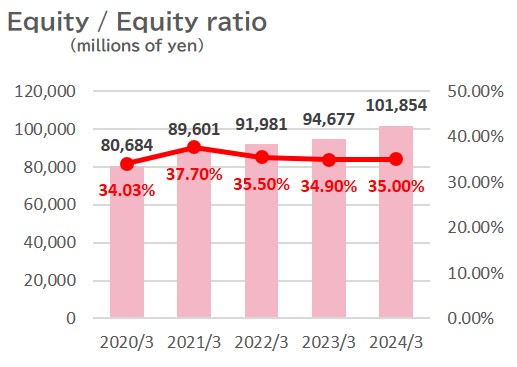
| Net assets | 81,028 | 90,242 | 92,605 | 95,240 | 102,409 |
| Statements of Cash Flows (in millions of yen) | |||||
| Net cash provided by (△ used in) operating activities | 12,970 | 5,982 | 10,213 | 8,338 | 24,094 |
| Net cash provided by (△ used in) investing activities | △2,843 | △3,509 | 4,776 | △2,845 | △34,240 |
| Net cash provided by (△ used in) financing Activities | △3,509 | △3,713 | △3,553 | △6,890 | △478 |
| Cash and cash equivalents at end of period | 43,246 | 41,947 | 53,536 | 52,395 | 42,044 |
| Safety and Per Share Data (yen) | |||||
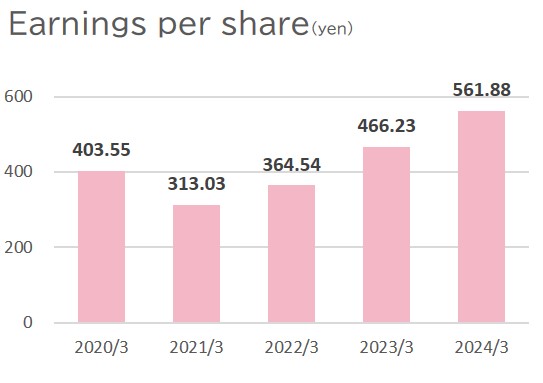
| Earnings per share | 403.55 | 313.03 | 364.54 | 466.23 | 561.88 |
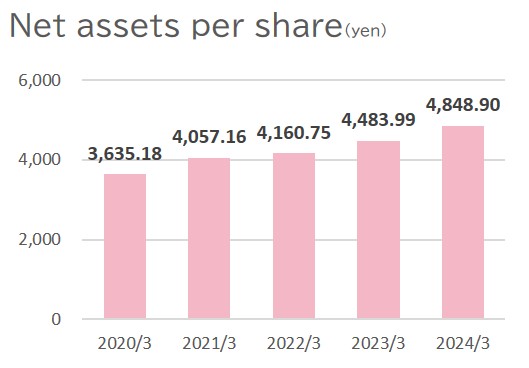
| Net assets per share | 3,635.18 | 4,057.16 | 4,160.75 | 4,483.99 | 4848.90 |
| Dividend per share (year) | 150 | 100 | 123 | 140 | 140 |
| Main Management Index (%) | |||||
| Return on equity (ROE) | 11.4 | 8.1 | 8.9 | 10.8 | 12.0 |
| Equity ratio | 34.0 | 37.7 | 35.5 | 34.9 | 35.0 |
* Figures for the prior fiscal years are retrospectively reclassified accordingly.